| V I S U A L I Z Z A D I S C U S S I O N E |
| ik3iul |
Inserito il - 29/06/2018 : 22:32:08
Siamo nei mesi estivi adatti a fare esperienza con i 50 MHZ-
LA MAGIC BAND.
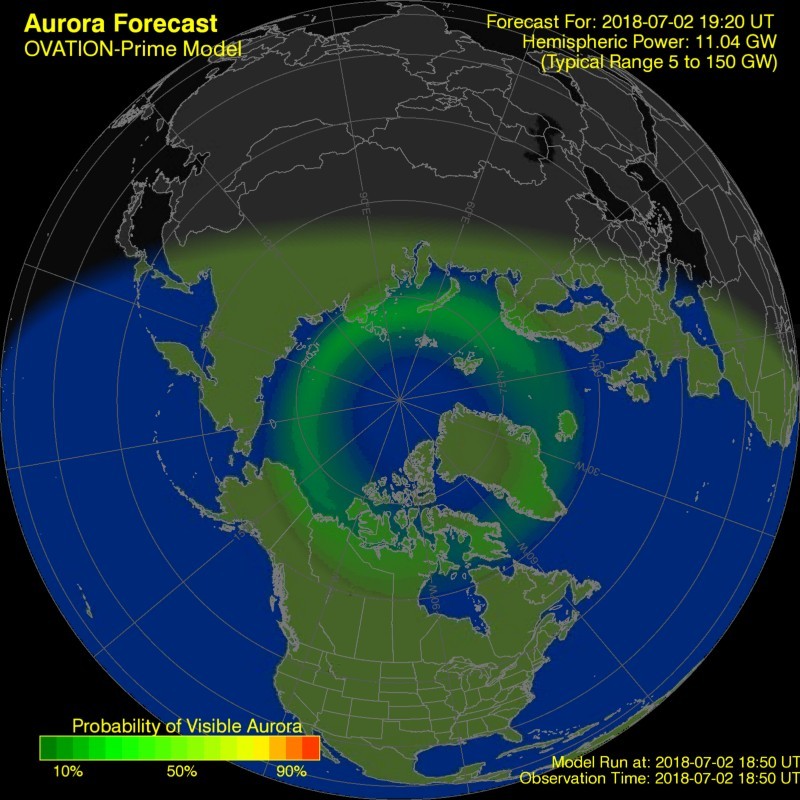
SOLAR DATA INFO
:Product: Weekly Highlights and Forecasts
:Issued: 2018 Aug 20 0445 UTC
# Prepared by the US Dept. of Commerce, NOAA, Space Weather Prediction Center
# Product description and SWPC contact on the Web
# http://www.swpc.noaa.gov/weekly.html
#
# Weekly Highlights and Forecasts
#
Highlights of Solar and Geomagnetic Activity
13 - 19 August 2018
Solar activity was very low. Two small regions developed on the
visible disk this period. Region 2718 (S07, L=191, class/area
Hrx/020 on 17 Aug) developed on 14 Aug and decayed to plage by 19
Aug. Region 2719 (S06, L=133, class/area Bxo/010 on 19 Aug)
developed in the SE quadrant on 19 Aug. No significant flare events
occurred from either region. Other activity included a filament
eruption centered near S11W04 observed lifting off the solar disk at
approximately 19/0538 UTC. An associated coronal mass ejection was
observed off the SW limb in SOHO/LASCO C2 imagery at 19/0812 UTC.
WSA/Enlil modelling of the event suggested the ejecta was primarily
directed westward of the Sun-Earth line and is not expected to cause
any significant effects.
No proton events were observed at geosynchronous orbit.
The greater than 2 MeV electron flux at geosynchronous orbit was at
normal levels on 13-15 Aug, moderate levels on 16-17 Aug, and at
high levels on 18-19 Aug. The largest flux of the period was 18,287
pfu observed at 19/1800 UTC.
Geomagnetic field activity ranged from quiet to active levels over
the period. Solar wind speed was at nominal levels at the beginning
of the period with solar wind speed ranging from 310-430 km/s while
total field was between 1-4 nT. The geomagnetic field was quiet on
13-14 Aug. By 15 Aug, solar wind speed increased to approximately
450-500 km/s with total field increasing to a maximum of 14 nT by
16/1005 UTC as a positive polarity coronal hole high speed stream
(CH HSS) moved into geoeffective position. A further increase in
solar wind speed to near 570 km/s was observed late on 17 Aug before
slowly receding to nominal levels by midday on 19 Aug. The
geomagnetic field responded with quiet to active levels on 15-18
Aug. By late on 19 Aug, total field increase again to 12 nT along
with an increase in solar wind to near 550 km/s as a negative
polarity CH HSS was becoming geoeffective. However, only quiet
levels were observed on 19 Aug.
Forecast of Solar and Geomagnetic Activity
20 August - 15 September 2018
Solar activity is expected to continue at very low levels.
No proton events are expected at geosynchronous orbit.
The greater than 2 MeV electron flux at geosynchronous orbit is
expected to reach high levels on 22-27 Aug and again on 13-15 Sep
due to CH HSS influence.
Geomagnetic field activity is expected to be unsettled to active
levels on 20-25 Aug, 03-04 Sep, 07 Sep, and 11-15 Sep with a chance
for G1 (Minor) geomagnetic storm levels on 20-21 Aug due to
recurrent CH HSS activity.
:Product: SWPC Space Weather Alerts ALTS.txt
:Issued: 2018 Aug 24 1333 UTC
# Prepared by the US Dept. of Commerce, NOAA, Space Weather Prediction Center
# See http://swpc.noaa.gov/alerts/ for description and other displays
# Send comments and suggestions to SWPC.Webmaster@noaa.gov
#
# SWPC Space Weather Alerts Issued in the last 24 hours
#---------------------------------------------------------------------
Space Weather Message Code: ALTEF3
Serial Number: 2826
Issue Time: 2018 Aug 24 1231 UTC
CONTINUED ALERT: Electron 2MeV Integral Flux exceeded 1000pfu
Continuation of Serial Number: 2825
Begin Time: 2018 Aug 18 1410 UTC
Yesterday Maximum 2MeV Flux: 4038 pfu
www.swpc.noaa.gov/noaa-scales-explanation
Potential Impacts: Satellite systems may experience significant charging resulting in increased risk to satellite systems.
#-------------------------------------------------
:Product: Report of Solar-Geophysical Activity
:Issued: 2018 Aug 23 2200 UTC
# Prepared jointly by the U.S. Dept. of Commerce, NOAA,
# Space Weather Prediction Center and the U.S. Air Force.
#
Joint USAF/NOAA Solar Geophysical Activity Report and Forecast
SDF Number 235 Issued at 2200Z on 23 Aug 2018
IA. Analysis of Solar Active Regions and Activity from 22/2100Z to
23/2100Z: Solar activity has been at very low levels for the past 24
hours. There are currently 1 numbered sunspot regions on the disk.
IB. Solar Activity Forecast: Solar activity is expected to be very low
with a slight chance for a C-class flare on days one, two, and three (24
Aug, 25 Aug, 26 Aug).
IIA. Geophysical Activity Summary 22/2100Z to 23/2100Z: The geomagnetic
field has been at quiet levels for the past 24 hours. Solar wind speed
reached a peak of 484 km/s at 22/2123Z. Electrons greater than 2 MeV at
geosynchronous orbit reached a peak level of 4038 pfu.
IIB. Geophysical Activity Forecast: The geomagnetic field is expected
to be at quiet to active levels on days one and two (24 Aug, 25 Aug) and
quiet to unsettled levels on day three (26 Aug).
III. Event probabilities 24 Aug-26 Aug
Class M 01/01/01
Class X 01/01/01
Proton 01/01/01
PCAF green
IV. Penticton 10.7 cm Flux
Observed 23 Aug 070
Predicted 24 Aug-26 Aug 070/070/070
90 Day Mean 23 Aug 071
V. Geomagnetic A Indices
Observed Afr/Ap 22 Aug 008/006
Estimated Afr/Ap 23 Aug 005/005
Predicted Afr/Ap 24 Aug-26 Aug 007/008-010/012-008/008
VI. Geomagnetic Activity Probabilities 24 Aug-26 Aug
A. Middle Latitudes
Active 25/35/25
Minor Storm 10/15/10
Major-severe storm 01/01/01
B. High Latitudes
Active 15/10/15
Minor Storm 25/25/25
Major-severe storm 40/50/35
STOP
Facciamo un breve ripasso seguendo una breve carrellata sui link
che propongo.
CLUSTER REAL TIME
http://uksmg.org/desktop.php
http://uksmg.org/dxcluster.php
http://www.n3kl.org/sun/noaa.html
www.uksmg.org/content/f2propagationmech.htm
www.qsl.net/ei7gl/ei5dd6m.htm
http://ionogram.suijs.info
(da monitorare sempre)
http://digisonde.com/stationlist.html
http://ionos.ingv.it/roma/latest.html
https://lgdc.uml.edu/common/DIDBFastStationList
http://giro.uml.edu/IonogramMovies/
http://k9la.us/The_M-Factor.pdf
M-Factor in ionosonda si esprime: M(3000 )F2.
Verifichiamo M(3000)F2 sul DIDBase ionogramma.
Quando questo valore risulta uguale o maggiore di 5(CINQUE)
lungo la tratta DX interessata la ionizzazione dello strato E spor.
risulta essere il 60% dello strato F2 PERMETTENDO la risalita del segnale dall'antenna(rifrazione E spor,) fino alla riflessione in F2 direttamente.
Sono condizioni particolarmente eccezionali che si verificano durante i picchi massimi di ciclo solare o...durante violenti FLARE.
Buona estate e ottimi DX in Magic Band.
Audio beacon e pile-up nelle diverse condizioni propagative in
banda SIX
http://www.qsl.net/n3db/ZD8VHF.rm
http://www.qsl.net/n3db/PY3DU.rm
http://www.qsl.net/n3db/XE1AA6RX.rm
http://www.qsl.net/n3db/Jan17pile.rm
CLUSTER CHAT E FREQUENCY BEACON AGGIORNATO
http://www.on4kst.com/index.php
https://www.keele.ac.uk/depts/por/50.htm
Allegato:  6M_Propagation.pdf 6M_Propagation.pdf
197,59 KB
Dopo tante accurate previsioni una YL da ...favola.
Immagine:

80,12 KB
20 Giugno S. Silverio 20. 23 utc qrg:50.093 CW
QSO DX via multipath E Sporadico
Immagine:
38,39 KB
Immagine:
27,14 KB
Time (hour) 0753 0754 0755 0756 0757
Bt (nT) 5 4 4 4 4
Bz (nT) 0 0 -1 -1 -1
Time (hour) 0753 0754 0755 0756 0757
Proton (p/cc) 3 3 3 2 3
Sws (km/s) 422 422 415 409 417
Controllare in"Solar data" il valore di Proton Flux durante i picchi transitori nel grafico
http://www.n3kl.org/sun/noaa.html
Info da ON4KST
http://www.on4kst.org/chat/index.php
OGGI 30 GIUGNO 2018
Time (hour) 1805 2105 0005 0305 0605
Solar flux 70 69 69 69 69
A-index 5 4 4 4 4
K-index 1 0 0 0 1
SSN 0 0 0 0 0
Proton Flux grafico.
Nota:durante i picchi la ionizzazione aumenta notevolmente favorendo aperture brevi sullo strato F e formazione o incremento di E sporadico
quando presente.
Definizione.
Flux density energy spectrum of low-, medium-, and high-energy protons from the magnetosphere, the radiation belts or the interplanetary medium, per unit solid angle.
VERDE= Bassa >>>>100 Mega elettron Volt/cmq/sec
BLU = Medium >>>>>50 Mega elettron Volt/cmq/sec
ROSSO=ALTA ENERGIA >10 Mega elettron Volt/cmq/sec
PROTON FLUX UNIT=PFU
Dobbiamo risalire a valore da 3 a 5 PFU per vedere almeno effetto Flare classe M.
Immagine:
6,86 KB
In questo esempio di grafico odierno non ci sono picchi sul grafico
colorato di ROSSO (Scala Rossa).
Il valore massimo,osservando la scala in ordinata,vale 0,5 PFU.
MOLTO BASSO.
.....a questa ora possiamo prendere il sole e attendere l'attivitŕ
crescente solare e relativo innalzamento della Proton Flux Unit.
http://www.n3kl.org/sun/noaa.html
Non si notano picchi.
Attendiamo pazientemente un brillamento di classe C o almeno M.
Ma di questi tempi si osservano molto raramente.
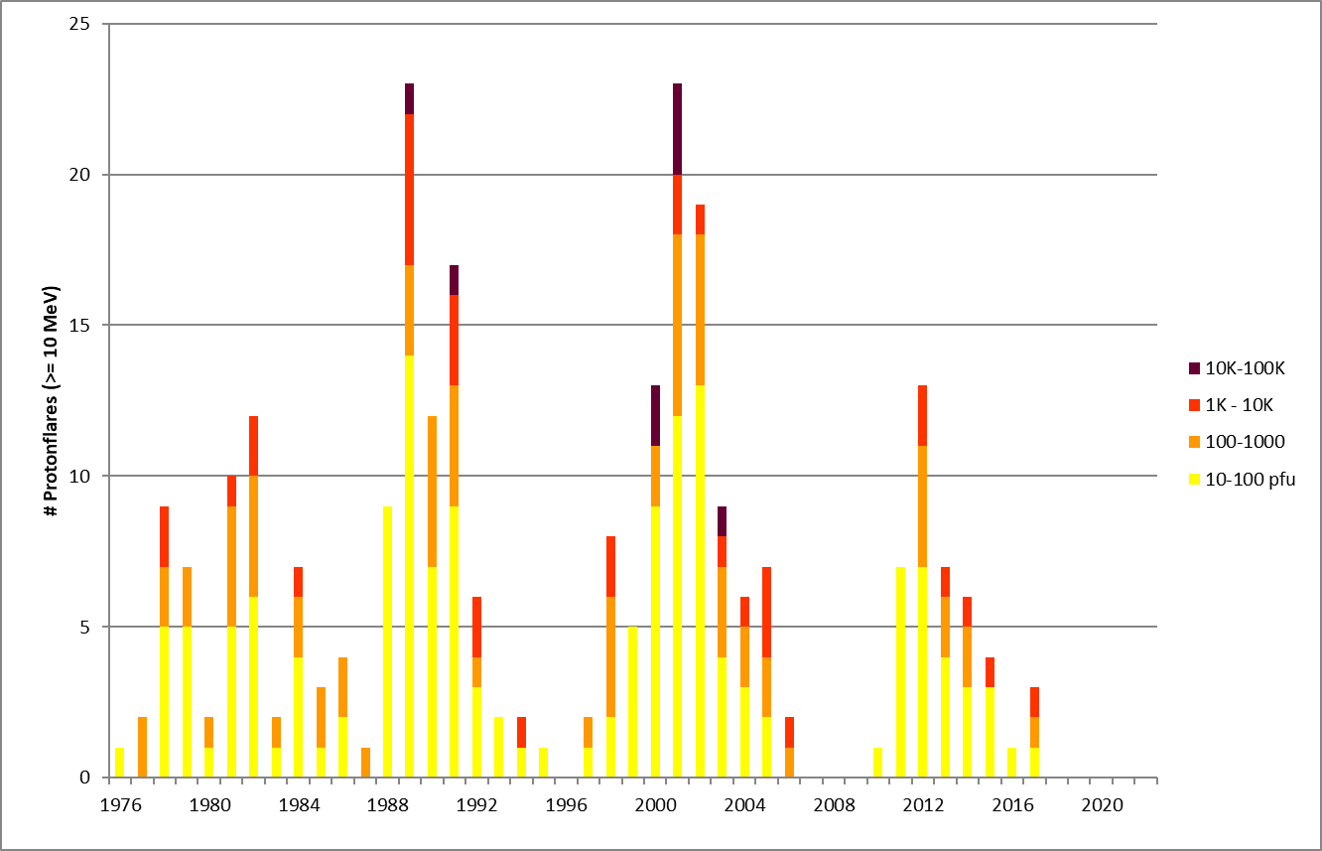
A solar proton event (SPE), or "proton storm", occurs when particles (mostly protons) emitted by the Sun become accelerated either close to the Sun during a flare or in interplanetary space by CME shocks. The events can include other nuclei such as helium ions and HZE ions. These particles cause multiple effects. They can penetrate the Earth's magnetic field and cause ionization in the ionosphere. The effect is similar to auroral events, except that protons rather than electrons are involved. Energetic protons are a significant radiation hazard to spacecraft and astronauts.
In basso lo storico che evidenzia durante i cicli solari le variazioni
nel tempo del Flusso Protonico.
Immagine:
75,42 KB
:Product: 3-Day Forecast
:Issued: 2018 Jun 30 0030 UTC
# Prepared by the U.S. Dept. of Commerce, NOAA, Space Weather Prediction Center
#
A. NOAA Geomagnetic Activity Observation and Forecast
The greatest observed 3 hr Kp over the past 24 hours was 2 (below NOAA
Scale levels).
The greatest expected 3 hr Kp for Jun 30-Jul 02 2018 is 3 (below NOAA
Scale levels).
NOAA Kp index breakdown Jun 30-Jul 02 2018
Jun 30 Jul 01 Jul 02
00-03UT 3 3 3
03-06UT 2 2 2
06-09UT 2 2 2
09-12UT 2 2 2
12-15UT 1 2 2
15-18UT 2 1 1
18-21UT 2 2 2
21-00UT 3 3 2
Rationale: No G1 (Minor) or greater geomagnetic storms are expected. No
significant transient or recurrent solar wind features are forecast.
Per i cultori in CW durante il DX in presenza di normale QSB
la velocita' di Keying a 20 WPM e il peso( coefficiente del tempo LINEA
rispetto al tempo PUNTO)con rapporto 1:3.
73 de Ik3iul
Immagine:

3,9 KB
Immagine:
153,8 KB
:Product: Weekly Highlights and Forecasts
:Issued: 2018 Jul 02 0504 UTC
# Prepared by the US Dept. of Commerce, NOAA, Space Weather Prediction Center
# Product description and SWPC contact on the Web
# http://www.swpc.noaa.gov/weekly.html
#
# Weekly Highlights and Forecasts
#
Highlights of Solar and Geomagnetic Activity
25 June - 01 July 2018
Solar activity was at very low levels. Region 2715 (N08, L=231,
class/area Dao/070 on 23 Jun) was the only spotted region on the
disk and was quiet throughout the summary period. No Earth-directed
CMEs were observed.
No proton events were observed at geosynchronous orbit.
The greater than 2 MeV electron flux at geosynchronous orbit was at
high levels throughout the period. A maximum flux of 5,570 pfu was
observed at 28/1935 UTC.
Geomagnetic field activity was at quiet to isolated G1 (Minor) storm
periods from late on 25 Jun through 26 Jun in response to an SSBC
from a positive to a negative sector observed midday on 25 Jun. A
CIR signature was evident early on 26 Jun in advance of an
equatorial, negative polarity CH HSS. Total field (Bt) peaked at 14
nT, the Bz component reached a maximum negative extent of -9 nT and
wind speeds increased from about 400 km/s to about 670 km/s; all
during 26 Jun. For the remainder of the summary period, field
conditions were at quiet levels with an isolated unsettled interval
late on 27 Jun. By the end of the summary period, Bt and Bz were at
nominal levels while wind speeds decreased to near 350 km/s.
Forecast of Solar and Geomagnetic Activity
02 July - 28 July 2018
Solar activity is expected to be at very low levels through 10 Jul.
With the return of old Region 2715 (N08, L=231) from 11-24 Jul,
activity levels are expected to remain at very low levels, with a
slight chance for C-class activity. A return to very low levels is
expected from 25-28 Jul.
No proton events are expected at geosynchronous orbit.
The greater than 2 MeV electron flux at geosynchronous orbit is
expected to be at high levels on 02-10 Jul and again on 21-28 Jul
due to CH HSS influence. Normal to moderate levels are expected from
11-20 Jul.
Geomagnetic field activity is expected to be at unsettled to active
levels on 15 Jul and 20-24 Jul with isolated G1 (Minor) geomagnetic
storms likely on 23 Jul, all due to recurrent CH HSS activity.
Mostly quiet levels are expected for the remainder of the outlook
period.
Allegato: IONIZZAZIONE.pdf
187,83 KB
ECCO IL LINK
https://iri.gsfc.nasa.gov/iri.html
https://ccmc.gsfc.nasa.gov/modelweb/models/iri_vitmo.php
rispettivamente IRI 2001 e IRI 2007
Da questo link(sempre che si mantenga disponibile)
si calcola il numero di elettroni per centimetro cubo, inserendo
soltanto questi input obbligatori:
Anno Giorno Mese e ora UTC
Lat Long della ionosonda che interpelliamo.
Sempre da ionosonda i parametri base:
F0F2 e M(3000)F2 -- Vedi foto sottostante Ionosonda Roma output-
Il numero medio di macchie solari SSN.
Tutto il resto rimane come impostato.
Vedremo ES E e F(F1 F2) nella componente elettroni/cm.cubo e altezza(km) relativa-
Disponibile Help.
Otteremo una stampa come questa sottostante:
ModelWeb Browser Results
iri model listing
Input parameters
year= 2000., month= 07, day= 02, hour=13.,
latitude= 45., longitude= 11., height= 1500.
Prof. parameters: start= 100. stop= 1500. step= 50.
URSI maps are used for the F2 peak density (NmF2)
CCIR maps are used for the F2 peak height (hmF2)
B0-Table option is used for the bottomside thickness parameter B0
Danilov- option is used for the ion composition
The foF2 STORM model is turned on
IRI-95 option is used for the electron temperature
IRI-95 option is used for the D-region Ne
Scotto-97 no L option is used for the F1 occurrence probability
F2 peak plasma frequency (foF2/MHz= 7.0) provided by user
Propag. factor (M(3000)F2= 4.0) provided by user
Peak Densities/cm-3: NmF2= 607600.0 NmF1= 0.0 NmE= 128561.4
Peak Heights/km: hmF2= 175.26 hmF1= 0.00 hmE= 110.00
Solar Zenith Angle/degree 30.1
Dip (Magnetic Inclination)/degree 60.58
Modip (Modified Dip)/degree 51.50
Solar Sunspot Number (12-months running mean) Rz12 14.0{user provided input}
Ionospheric-Effective Solar Index IG12 139.9
-
H ELECTRON DENSITY TEMPERATURES ION PERCENTAGES/% 1E16m-2
km Ne/cm-3 Ne/NmF2 Tn/K Ti/K Te/K O+ N+ H+ He+ O2+ NO+ Clust TEC t/%
100.0 99721 0.164 -1 -1 -1 0 0 0 0 36 64 0 -1.0 -1
150.0 542574 0.893 641 641 781 6 0 0 0 32 62 0 -1.0 -1
200.0 590595 0.972 791 791 1487 22 0 0 0 27 51 0 -1.0 -1
250.0 477371 0.786 824 883 1849 93 0 0 0 3 4 0 -1.0 -1
300.0 330181 0.543 831 976 2087 100 0 0 0 0 0 0 -1.0 -1
350.0 209875 0.345 833 1069 2057 100 0 0 0 0 0 0 -1.0 -1
400.0 130844 0.215 833 1162 2040 100 0 0 0 0 0 0 -1.0 -1
450.0 83897 0.138 833 1279 2208 99 1 0 0 0 0 0 -1.0 -1
500.0 56848 0.094 834 1427 2411 96 4 0 0 0 0 0 -1.0 -1
550.0 41125 0.068 834 1577 2610 92 8 0 0 0 0 0 -1.0 -1
600.0 31727 0.052 834 1726 2772 90 9 0 1 0 0 0 -1.0 -1
650.0 25918 0.043 834 1876 2848 88 10 1 1 0 0 0 -1.0 -1
700.0 22208 0.037 834 2025 2888 85 11 2 2 0 0 0 -1.0 -1
750.0 19771 0.033 834 2175 2923 82 12 3 3 0 0 0 -1.0 -1
800.0 18132 0.030 834 2325 2957 77 13 5 5 0 0 0 -1.0 -1
850.0 17011 0.028 834 2474 2991 71 13 9 7 0 0 0 -1.0 -1
900.0 16234 0.027 834 2624 3026 63 13 15 9 0 0 0 -1.0 -1
950.0 15689 0.026 834 2774 3060 54 11 23 11 0 0 0 -1.0 -1
1000.0 15304 0.025 834 2923 3095 45 9 34 12 0 0 0 -1.0 -1
1050.0 15032 0.025 834 3071 3129 35 7 47 12 0 0 0 -1.0 -1
1100.0 14837 0.024 834 3162 3164 25 4 60 10 0 0 0 -1.0 -1
1150.0 14699 0.024 834 3198 3198 17 2 71 9 0 0 0 -1.0 -1
1200.0 14600 0.024 834 3232 3233 11 1 80 7 0 0 0 -1.0 -1
1250.0 14529 0.024 834 3267 3267 7 1 86 6 0 0 0 -1.0 -1
1300.0 14479 0.024 834 3301 3301 5 0 89 6 0 0 0 -1.0 -1
1350.0 14443 0.024 834 3336 3336 4 0 90 6 0 0 0 -1.0 -1
1400.0 14417 0.024 834 3375 3376 3 0 91 6 0 0 0 -1.0 -1
1450.0 14398 0.024 834 3425 3425 2 0 92 6 0 0 0 -1.0 -1
1500.0 14385 0.024 834 3478 3479 2 0 92 6 0 0 0 -1.0 -1
A value of -1 indicates that the parameter is not available for the specified range
TEC=-1, means you have not entered an upper boundary height in the OPTIONAL INPUT section.
Immagine:
39,11 KB
Immagine:
8,49 KB
Dal grafico si riscontra il valore Nr. elettr/mc a quota E spor. e F1.
Quando il rapporto supera il 60 per cento..(E Spor./F1) possibile il passaggio in F1 dopo rifrazione in E spor.
Maggiore skip..apertura propagativa in atto.
Un caso abbastanza raro da intercettare ma che si verifica per aperture DX seguendo le considerazioni da me proposte.
Quando chiamiamo su QRG DX pensiamo prima a valutare se ci sono le condizioni da me trattate...e poi CQ DX.
Buoni DX in bada SIX METERS e
pratichiamo anche il CW (ANALOGICO)
e non solo il DIGITALE FT8.
....con pazienza e attenzione alle improvvise e graduali
APERTURE PROPAGATIVE
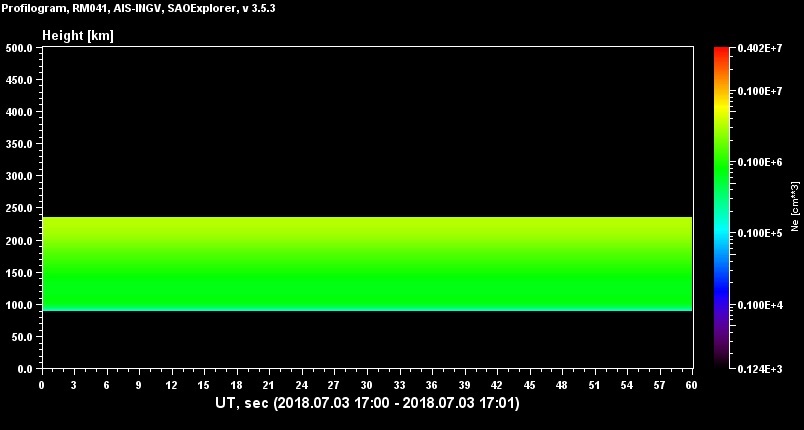
Immagine:
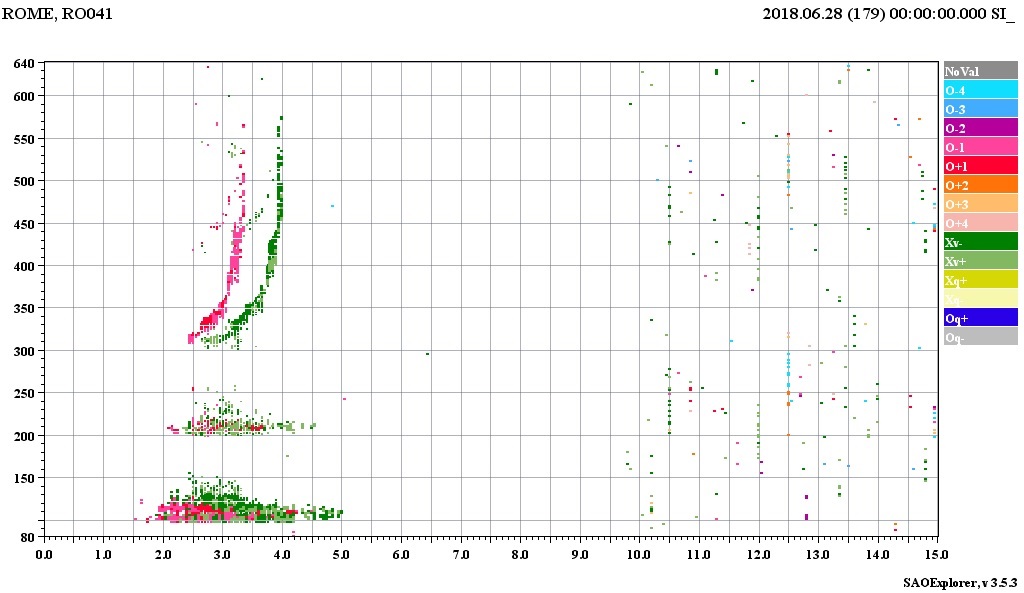
135,39 KB
Immagine dal database SAO EXPLORER di:IONOSONDA ROMA
In ordinata ALTEZZA e in ascissa Ne/cm.cubo.
Immagine:
56,94 KB
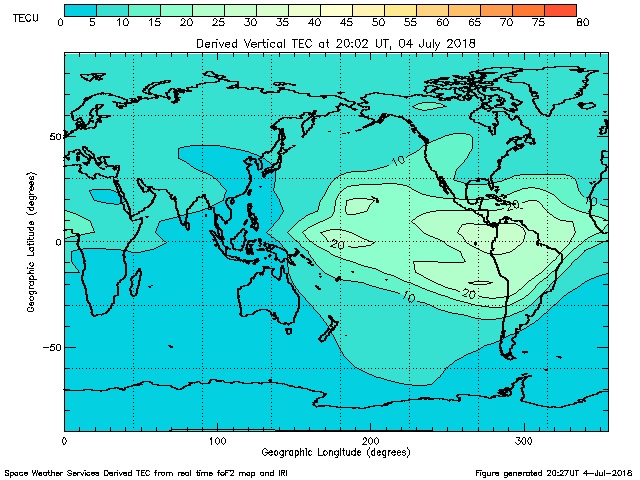
Real Time W.W. Total Electron Content
http://www.sws.bom.gov.au/Satellite/2/2
Immagine:
143,35 KB
Oggi 11 Luglio la ionosonda roma mostra questi valori di F0F2:4.9
Dalle considerazioni sopra esposte(FoF2 prossima a 5) il cluster ci conferma le
multiple aperture ES--F2 con il GIAPPONE.
Verificate ionosonda roma e cluster ore =09.30 UTC
Provando Riprovando (G. Marconi). |
| 1 U L T I M E R I S P O S T E (in alto le piů recenti) |
| ik3avm |
Inserito il - 08/07/2018 : 22:22:22
Ciao Silverio,
stavolta una critica!
Il post attuale č decisamente troppo lungo e verboso e non invita alla lettura quegli eventuali due o tre improbabili frequentatori di questo forum.
Si suppone che chi legge sia per lo piů all'oscuro di flussi protonici, mega elettronvolt, "nuclei such as helium" eccetera eccetera.
Il lettore medio che volesse capire cerca POCHISSIMI dati, e, soprattutto, COMMENTATI!
Una tabellina con la sua spiegazioncina, che lo aiuti (se vuole) a capire perchč quella settimana c'č o non c'č propagazione in sei metri.
Se poi nemmeno tre righe commentate suscitano interesse, figuriamoci un post chilometrico in inglese... nessuno si sogna di andare oltre la seconda riga.
Se viceversa qualcuno mostrerŕ interesse, potrai approfondire con ulteriori dati (commentati!).
Sono sicuro che capirai quello che voglio dire con questa critica, che ha finalitŕ costruttive.
(e vediamo se anch'essa si risolverŕ con il solito sterile palleggio tra noi due soli...).
In gamba, ciao!
Alberto
|
|
|